| 243 | 69 | Mozilla/5.0 AppleWebKit/537.36 (KHTML, like Gecko; compatible; Amazonbot/0.1; +https://developer.amazon.com/support/amazonbot) Chrome/119.0.6045.214 Safari/537.36 |
| 211 | 31 | Mozilla/5.0 AppleWebKit/537.36 (KHTML, like Gecko; compatible; GPTBot/1.3; +https://openai.com/gptbot) |
| 480 | 30 | Mozilla/5.0 (X11; Linux x86_64) AppleWebKit/537.36 (KHTML, like Gecko) Chrome/130.0.0.0 Safari/537.36 |
| 3552 | 26 | Mozilla/5.0 AppleWebKit/537.36 (KHTML, like Gecko; compatible; GPTBot/1.2; +https://openai.com/gptbot) |
| 29 | 19 | Mozilla/5.0 (Windows NT 10.0; Win64; x64) AppleWebKit/537.36 (KHTML, like Gecko) Chrome/120.0.0.0 Safari/537.36 |
| 38 | 14 | Mozilla/5.0 (compatible; MJ12bot/v1.4.8; http://mj12bot.com/) |
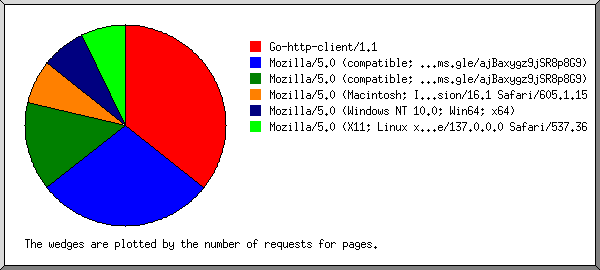
| 25 | 10 | Mozilla/5.0 (compatible; wpbot/1.3; +https://forms.gle/ajBaxygz9jSR8p8G9) |
| 39 | 9 | Mozilla/5.0 (compatible; Barkrowler/0.9; +https://babbar.tech/crawler) |
| 22 | 8 | Mozilla/5.0 (Windows NT 10.0; Win64; x64; rv:109.0) Gecko/20100101 Firefox/121.0 |
| 9 | 6 | Go-http-client/1.1 |
| 8 | 4 | Mozilla/5.0 (compatible; Konqueror/3; Linux) |
| 6 | 4 | Mozilla/5.0 (X11; Ubuntu; Linux x86_64; rv:109.0) Gecko/20100101 Firefox/121.0 |
| 48 | 3 | Mozilla/5.0 (X11; Linux x86_64) AppleWebKit/537.36 (KHTML, like Gecko) Chrome/140.0.0.0 Safari/537.36 |
| 3 | 3 | Mozilla/5.0 (Windows NT 10.0; Win64; x64) AppleWebKit/537.36 (KHTML, like Gecko) Chrome/122.0.0.0 Safari/537.36 |
| 3 | 3 | Mozilla/5.0 (Linux; Android 10; K) AppleWebKit/537.36 (KHTML, like Gecko) Chrome/122.0.0.0 Mobile Safari/537.36 |
| 3 | 3 | RecordedFuture Global Inventory Crawler |
| 38 | 3 | Mozilla/5.0 (Macintosh; Intel Mac OS X 10_15_7) AppleWebKit/537.36 (KHTML, like Gecko) Chrome/131.0.0.0 Safari/537.36; compatible; OAI-SearchBot/1.3; +https://openai.com/searchbot |
| 25 | 3 | Mozilla/5.0 (Linux; Android 6.0.1; Nexus 5X Build/MMB29P) AppleWebKit/537.36 (KHTML, like Gecko) Chrome/141.0.7390.122 Mobile Safari/537.36 (compatible; Googlebot/2.1; +http://www.google.com/bot.html) |
| 51 | 3 | Mozilla/5.0 (X11; Linux x86_64) AppleWebKit/537.36 (KHTML, like Gecko) HeadlessChrome/138.0.7204.23 Safari/537.36 |
| 3 | 2 | Mozilla/5.0 (Windows; U; Windows NT 5.0; en-US; rv:1.4b) Gecko/20030516 Mozilla Firebird/0.6 |
| 3 | 2 | Mozilla/5.0 (Macintosh; U; PPC Mac OS X Mach-O; en-US; rv:1.4a) Gecko/20030401 |
| 10 | 2 | okhttp/5.3.0 |
| 40 | 2 | Mozilla/5.0 (X11; Linux x86_64) AppleWebKit/537.36 (KHTML, like Gecko) Chrome/141.0.0.0 Safari/537.36 |
| 2 | 2 | Mozilla/5.0 (compatible; MSIE 10.0; Windows NT 6.1; Trident/6.0) |
| 2 | 2 | Mozilla/5.0 (Windows NT 6.1; Win64; x64) AppleWebKit/537.36 (KHTML, like Gecko) Chrome/55.0.2883.87 Safari/537.36 |
| 2 | 2 | Mozilla/5.0 (Windows NT 10.0; WOW64; Trident/7.0; rv:11.0) like Gecko |
| 6 | 2 | Mozilla/5.0 (compatible; wpbot/1.4; +https://forms.gle/ajBaxygz9jSR8p8G9) |
| 3 | 2 | Mozilla/5.0 (Windows NT 10.0; Win64; x64) AppleWebKit/537.36 (KHTML, like Gecko) Chrome/120.0.0.0 Safari/537.36 Edg/120.0.2210.133 |
| 4 | 2 | Mozilla/5.0 (compatible; wpbot/1.2; +https://forms.gle/ajBaxygz9jSR8p8G9) |
| 7 | 2 | Mozilla/5.0 (X11; U; Linux i686; en-US; rv:1.4) Gecko/20030624 |
| 1 | 1 | Mozilla/5.0 (Macintosh; Intel Mac OS X 10_15_7) AppleWebKit/537.36 (KHTML, like Gecko) Chrome/122.0.0.0 Safari/537.36 |
| 1 | 1 | Mozilla/5.0 (Windows NT 10.0; Win64; x64) AppleWebKit/537.36 (KHTML, like Gecko) Chrome/121.0.0.0 Safari/537.36 Edg/121.0.0.0 GLS/100.10.9850.99 |
| 1 | 1 | Mozilla/5.0 (Windows NT 10.0; Win64; x64; rv:123.0) Gecko/20100101 Firefox/123.0 |
| 4 | 1 | Mozilla/5.0 (Macintosh; Intel Mac OS X 10_15_7) AppleWebKit/537.36 (KHTML, like Gecko) Chrome/114.0.0.0 Safari/537.36 |
| 1 | 1 | Mozilla/5.096783921 Mozilla/5.0 (Windows NT 10.0; WOW64; Trident/7.0; rv:11.0) like Gecko |
| 1 | 1 | Mozilla/5.0 (iPhone; CPU iPhone OS 17_1 like Mac OS X) AppleWebKit/605.1.15 (KHTML, like Gecko) EdgiOS/119.0.2151.78 Version/17.0 Mobile/15E148 Safari/604.1 |
| 16 | 1 | Mozilla/5.0 (X11; Linux x86_64) AppleWebKit/537.36 (KHTML, like Gecko) HeadlessChrome/137.0.0.0 Safari/537.36 |
| 1 | 1 | Mozilla/5.0 (Windows NT 10.0; Win64; x64) AppleWebKit/537.36 (KHTML, like Gecko) Chrome/121.0.0.0 Safari/537.36 Edg/121.0.0.0 Unique/97.7.7286.70 |
| 1 | 1 | Mozilla/5.0 (Windows NT 6.1) AppleWebKit/537.36 (KHTML, like Gecko) Chrome/60.0.3112.113 Safari/537.36 |
| 1 | 1 | Mozilla/5.0 (iPhone; CPU iPhone OS 17_1 like Mac OS X) AppleWebKit/605.1.15 (KHTML, like Gecko) EdgiOS/121.0.2277.107 Version/17.0 Mobile/15E148 Safari/604.1 |
| 497 | 5 | [not listed: 17 browsers] |
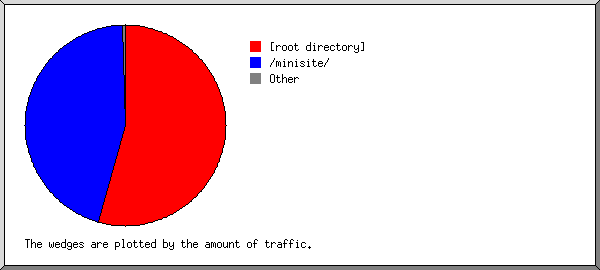
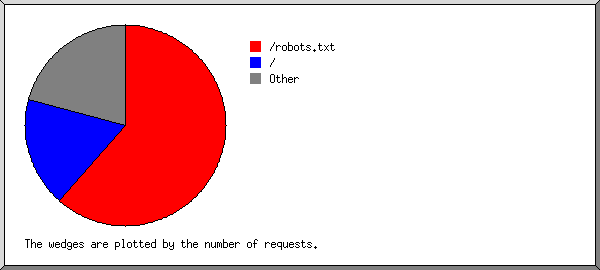
 Web Server Statistics for microsite.lacurevillas.com.propertiesinparadiseaxa.com
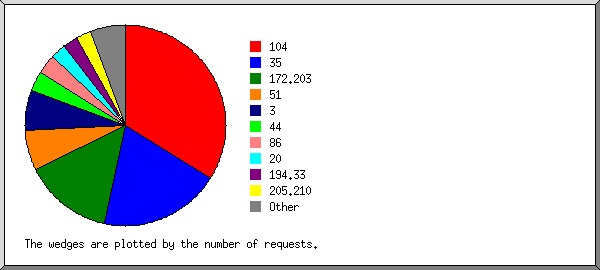
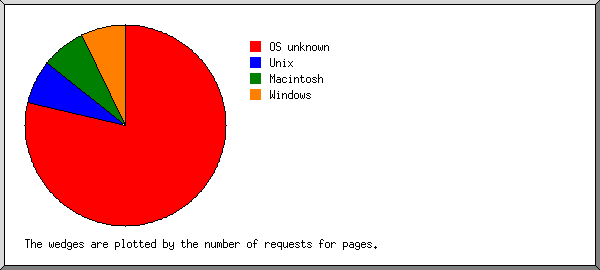
 ) represents 3 requests for pages or part thereof.