Web Server Statistics for microsite.lacurevillas.com.propertiesinparadiseaxa.com

Program started on Sat, May 31 2025 at 5:13 AM.
Analyzed requests from Sat, Nov 16 2024 at 3:11 AM to Sat, May 31 2025 at 2:43 AM (195.98 days).

General Summary

(Go To: Top | General Summary | Monthly Report | Daily Summary | Hourly Summary | Domain Report | Organization Report | Browser Report | Browser Summary | Operating System Report | Status Code Report | File Size Report | File Type Report | Directory Report | Request Report)

Figures in parentheses refer to the 7-day period ending May 31 2025 at 5:13 AM.

Successful requests: 47 (20)
Successful requests for pages: 13 (0)
Failed requests: 2 (0)
Distinct files requested: 17 (2)
Distinct hosts served: 35 (3)
Data transferred: 647.93 kilobytes (251.68 kilobytes)
Average data transferred per day: 3.31 kilobytes (35.95 kilobytes)

Monthly Report

(Go To: Top | General Summary | Monthly Report | Daily Summary | Hourly Summary | Domain Report | Organization Report | Browser Report | Browser Summary | Operating System Report | Status Code Report | File Size Report | File Type Report | Directory Report | Request Report)

Each unit (+) represents 1 request for a page.
month#reqs#pages 
Nov 202411+
Dec 202421+
    
Jan 202583+++
Feb 202542++
Mar 202542++
Apr 202542++
May 2025242++

Busiest month: Jan 2025 (3 requests for pages).

Daily Summary

(Go To: Top | General Summary | Monthly Report | Daily Summary | Hourly Summary | Domain Report | Organization Report | Browser Report | Browser Summary | Operating System Report | Status Code Report | File Size Report | File Type Report | Directory Report | Request Report)

Each unit (+) represents 1 request for a page.
day#reqs#pages 
Sun63+++
Mon73+++
Tue62++
Wed51+
Thu52++
Fri51+
Sat131+

Hourly Summary

(Go To: Top | General Summary | Monthly Report | Daily Summary | Hourly Summary | Domain Report | Organization Report | Browser Report | Browser Summary | Operating System Report | Status Code Report | File Size Report | File Type Report | Directory Report | Request Report)

Each unit (+) represents 1 request for a page.
hour#reqs#pages 
040
111+
220
311+
410
532++
600
710
800
900
1050
1160
1232++
1300
1400
1520
1631+
1742++
1821+
1931+
2042++
2110
2200
2310

Domain Report

(Go To: Top | General Summary | Monthly Report | Daily Summary | Hourly Summary | Domain Report | Organization Report | Browser Report | Browser Summary | Operating System Report | Status Code Report | File Size Report | File Type Report | Directory Report | Request Report)

Listing domains, sorted by the amount of traffic.

#reqs%bytesdomain
47100%[unresolved numerical addresses]

Organization Report

(Go To: Top | General Summary | Monthly Report | Daily Summary | Hourly Summary | Domain Report | Organization Report | Browser Report | Browser Summary | Operating System Report | Status Code Report | File Size Report | File Type Report | Directory Report | Request Report)

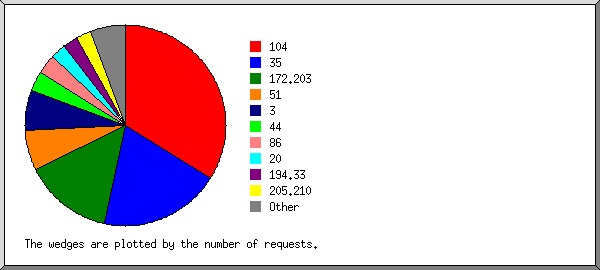
Listing organizations, sorted by the number of requests.

#reqs%bytesorganization
837.12%51
6 0.04%104
610.29%35
6 6.53%172.203
4 6.86%44
419.66%86
3 0.02%194.33
3 5.42%20
2 7.19%205.210
1 0.01%188.130
1 3.42%135.148
1 0.01%45
1 3.42%198.235
1 0.01%46

Browser Report

(Go To: Top | General Summary | Monthly Report | Daily Summary | Hourly Summary | Domain Report | Organization Report | Browser Report | Browser Summary | Operating System Report | Status Code Report | File Size Report | File Type Report | Directory Report | Request Report)

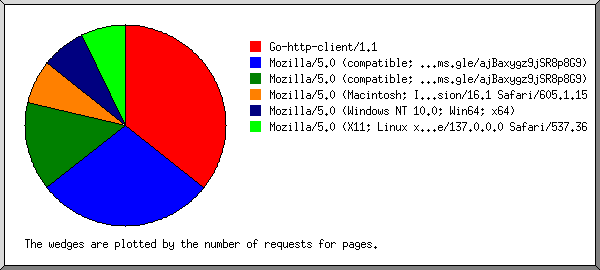
Listing browsers with at least 1 request for a page, sorted by the number of requests for pages.

#reqs#pagesbrowser
63Mozilla/5.0 (compatible; wpbot/1.3; +https://forms.gle/ajBaxygz9jSR8p8G9)
42Mozilla/5.0 (compatible; wpbot/1.2; +https://forms.gle/ajBaxygz9jSR8p8G9)
41Mozilla/5.0 (Windows NT 10.0; Win64; x64)
260[not listed: 3 browsers]

Browser Summary

(Go To: Top | General Summary | Monthly Report | Daily Summary | Hourly Summary | Domain Report | Organization Report | Browser Report | Browser Summary | Operating System Report | Status Code Report | File Size Report | File Type Report | Directory Report | Request Report)

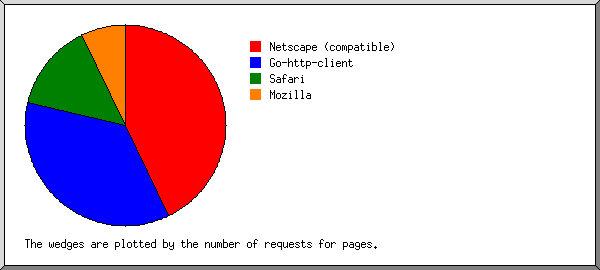
Listing browsers with at least 1 request for a page, sorted by the number of requests for pages.

##reqs#pagesbrowser
1125Netscape (compatible)
2101Mozilla
 180[not listed: 1 browser]

Operating System Report

(Go To: Top | General Summary | Monthly Report | Daily Summary | Hourly Summary | Domain Report | Organization Report | Browser Report | Browser Summary | Operating System Report | Status Code Report | File Size Report | File Type Report | Directory Report | Request Report)

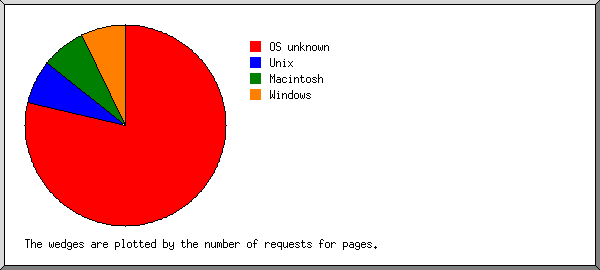
Listing operating systems, sorted by the number of requests for pages.

##reqs#pagesOS
1185OS unknown
241Windows
 41  Windows NT
3180Macintosh

Status Code Report

(Go To: Top | General Summary | Monthly Report | Daily Summary | Hourly Summary | Domain Report | Organization Report | Browser Report | Browser Summary | Operating System Report | Status Code Report | File Size Report | File Type Report | Directory Report | Request Report)

Listing status codes, sorted numerically.

#reqsstatus code
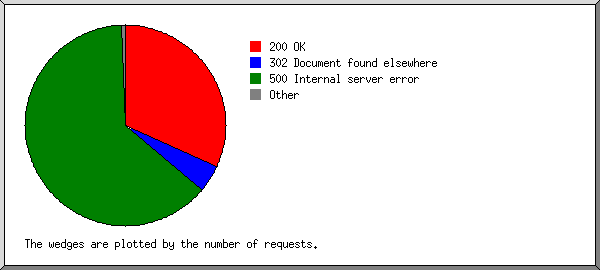
47200 OK
2500 Internal server error

File Size Report

(Go To: Top | General Summary | Monthly Report | Daily Summary | Hourly Summary | Domain Report | Organization Report | Browser Report | Browser Summary | Operating System Report | Status Code Report | File Size Report | File Type Report | Directory Report | Request Report)

size#reqs%bytes
00 
1B- 10B0 
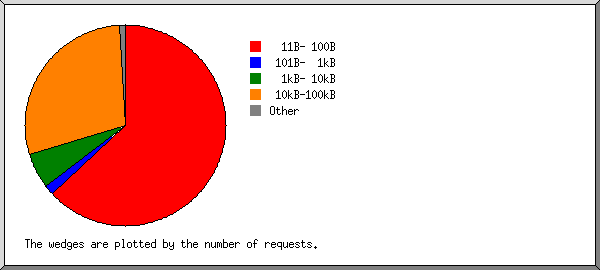
11B- 100B24 0.18%
101B- 1kB0 
1kB- 10kB1 0.99%
10kB-100kB2298.83%

File Type Report

(Go To: Top | General Summary | Monthly Report | Daily Summary | Hourly Summary | Domain Report | Organization Report | Browser Report | Browser Summary | Operating System Report | Status Code Report | File Size Report | File Type Report | Directory Report | Request Report)

Listing extensions with at least 0.1% of the traffic, sorted by the amount of traffic.

#reqs%bytesextension
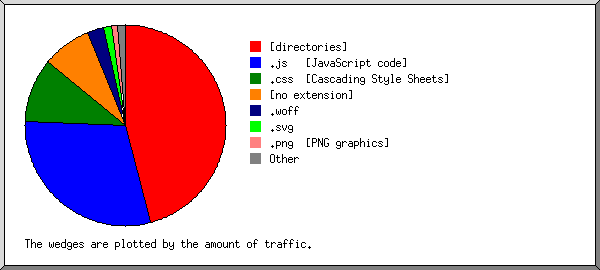
1344.83%[directories]
632.48%.js [JavaScript code]
212.99%[no extension]
2 8.53%.css [Cascading Style Sheets]
1 0.99%.svg
23 0.17%.txt [Plain text]

Directory Report

(Go To: Top | General Summary | Monthly Report | Daily Summary | Hourly Summary | Domain Report | Organization Report | Browser Report | Browser Summary | Operating System Report | Status Code Report | File Size Report | File Type Report | Directory Report | Request Report)

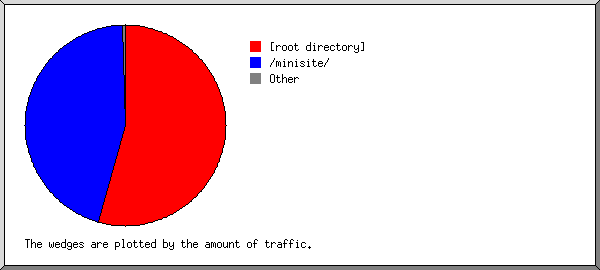
Listing directories with at least 0.01% of the traffic, sorted by the amount of traffic.

#reqs%bytesdirectory
3857.99%[root directory]
942.01%/minisite/

Request Report

(Go To: Top | General Summary | Monthly Report | Daily Summary | Hourly Summary | Domain Report | Organization Report | Browser Report | Browser Summary | Operating System Report | Status Code Report | File Size Report | File Type Report | Directory Report | Request Report)

Listing files with at least 20 requests, sorted by the number of requests.

#reqs%byteslast timefile
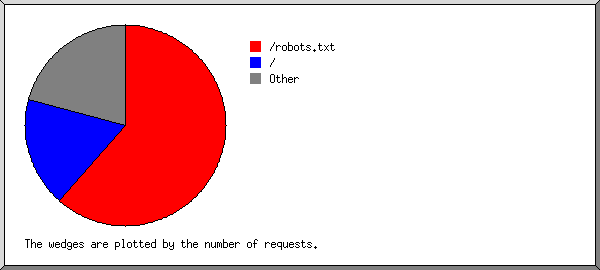
23 0.17%May/31/25 2:43 AM/robots.txt
11 0.08%May/27/25 6:42 PM  /robots.txt?51.81.46.212
2499.83%May/25/25 7:50 PM[not listed: 8 files]