(Go To: Top | General Summary | Monthly Report | Daily Summary | Hourly Summary | Domain Report | Organization Report | Referring Site Report | Browser Report | Browser Summary | Operating System Report | Status Code Report | File Size Report | File Type Report | Directory Report | Request Report)
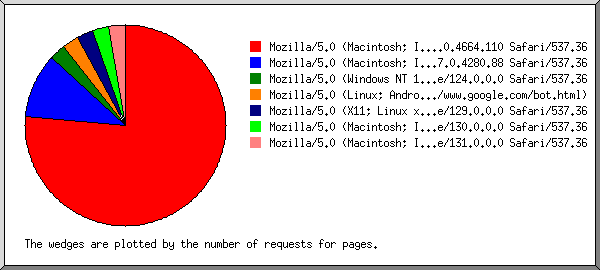
Listing browsers with at least 1 request for a page, sorted by the number of requests for pages.
| #reqs | #pages | browser |
|---|
| 20 | 12 | Mozilla/5.0 (Macintosh; Intel Mac OS X 10_15_7) AppleWebKit/537.36 (KHTML, like Gecko) Chrome/96.0.4664.110 Safari/537.36 |
| 1 | 1 | Mozilla/5.0 (Windows NT 10.0; Win64; x64) AppleWebKit/537.36 (KHTML, like Gecko; compatible; BW/1.2; rb.gy/oupwis) Chrome/124.0.0.0 Safari/537.36 |
| 12 | 1 | Mozilla/5.0 (Linux; Android 6.0.1; Nexus 5X Build/MMB29P) AppleWebKit/537.36 (KHTML, like Gecko) Chrome/131.0.6778.69 Mobile Safari/537.36 (compatible; Googlebot/2.1; +http://www.google.com/bot.html) |
| 2 | 1 | Mozilla/5.0 (X11; Linux x86_64) AppleWebKit/537.36 (KHTML, like Gecko) Chrome/129.0.0.0 Safari/537.36 |
| 9 | 1 | Mozilla/5.0 (Macintosh; Intel Mac OS X 10_15_7) AppleWebKit/537.36 (KHTML, like Gecko) Chrome/130.0.0.0 Safari/537.36 |
| 16 | 1 | Mozilla/5.0 (Macintosh; Intel Mac OS X 10_15_7) AppleWebKit/537.36 (KHTML, like Gecko) Chrome/131.0.0.0 Safari/537.36 |
| 15 | 0 | [not listed: 3 browsers] |
 Web Server Statistics for west.kishtionmeadsbay.com
 ) represents 1 request for a page.